Coldwater Creek’s stock over past five years: a humbling graphic
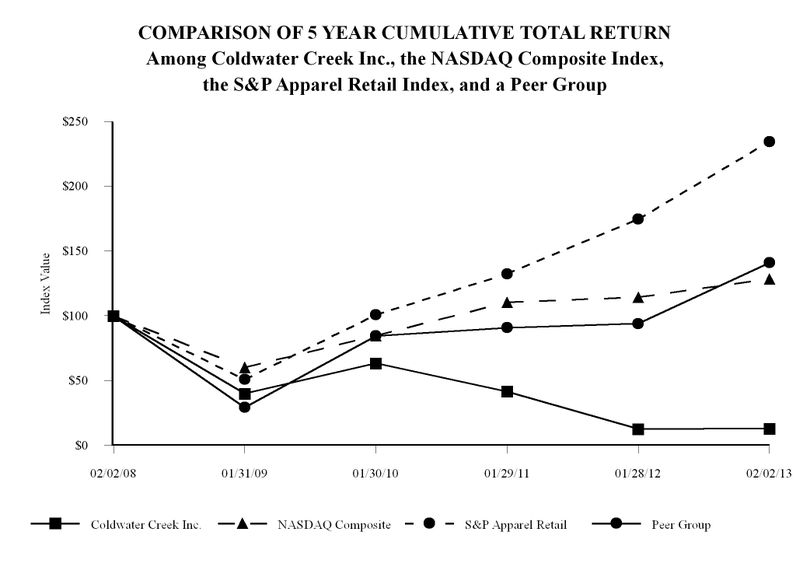
The good news for investors in Coldwater Creek, it has to get better.
We spotted this chart in the Sandpoint-based women's clothing retailer's annual report for the fiscal year ending Feb. 2. The chart came with the company-written explanation below.
If you can't read the graphic, here's the summary of what the FOUR key lines represent: (Also, click the chart to enlarge it.)
SOLID line with rectangle is Coldwater's stock valuation measured as an index starting in Feb. 2008 at 100. All four indices started at the same 100 point five years ago.
DASH line: NASDAQ composite.
DOT dash line: S&P apparel retail group.
SOLID line with circle: Apparel peer group.
The following graph compares the cumulative five-year total return to stockholders on Coldwater Creek Inc.'s common stock to the cumulative total returns of the NASDAQ Composite Index, the S&P Apparel Retail Index, and a customized peer group of Chico's, Christopher & Banks, and ANN INC (referred to as the "Peer Group"). Due to Talbots, one of the companies that was included in the Peer Group for fiscal 2011, becoming a privately held company, and in an effort to include a broader range of companies that includes industry sectors in which we operate, instead of comparing our stock performance to an individually selected group of peer companies, we have used a published industry index. Accordingly, for fiscal 2012, we are including the S&P Apparel Retail Index and we do not intend to present the Peer Group in future fiscal years. The stock performance shown below is not necessarily indicative of future performance.
