Record number of ballots didn’t mean record turnout
Spokane County certified its ballot results last week, which gives us the final piece of the 2016 election puzzle, the turnout.
It was better than ever. And it wasn’t as good as in some past elections.
Like most things in politics, it depends on how you want to spin it. Vince Lombardi, Scotty Bowman or whoever really first said “statistics are for losers” either forgot to add ‘…and political pundits” or figured that was a redundancy.
The 239,229 ballots cast are the most ever counted in an election in Spokane. Yay for us.
The 306, 261 registered voters are also the most ever signed up in Spokane. Yay again.
But as a percentage of registered voters casting a ballot, it’s not a record. The number of voters voting did not grow as fast as the number of voters registering. This year’s 78.1 percent is pretty middling by historic standards, and lower than all the presidential elections since 2000, when the George W. Bush v. Al Gore matchup enticed only 76 percent of the voters to cast a ballot.
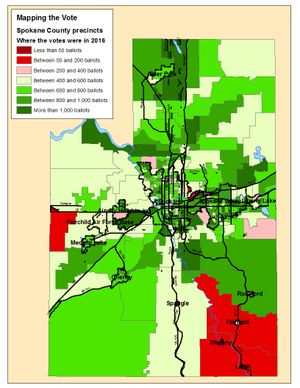
An analysis of the precinct breakdowns show that all areas of the community have more registered voters than the last presidential election in 2012. Some areas had fewer votes, while others had significantly more.
Northeast Spokane precincts, those east of Division from the river to Hillyard, had fewer people turning in ballots than four years ago. Some individual precincts in cities and unincorporated areas also saw drops, including the precinct that encompasses Fairchild Air Force Base.
Because the boundary lines have changed, and some precincts get split as their population grows, it’s hard to make direct comparisons for all 355 precincts. But it is possible to say that compared to 2012, the City of Spokane Valley turned in an extra 2,224, the unincorporated areas of the Valley an extra 1,656, and Liberty Lake an extra 948.
In the City of Spokane, downtown and the lower South Hill managed an extra 646 ballots, the upper South Hill an extra 1,187, the far northwest precincts an extra 720 and the West Central to Division another 720, thanks in part to the growth in the precincts around Kendall Yards.
The rural areas in south Spokane County stayed pretty close to even.
Put another way – the way candidates and political parties are likely to see it – registration in almost all precincts grew by a couple of percentage points, while percentage of ballots turned in dropped.
But turnout doesn’t elect candidates or pass ballot measures. Votes do. The precincts that traditionally vote Republican turned in more ballots than those that traditionally vote Democratic.
Click the document link at the top of this post to see the precinct breakdowns for ballots.

