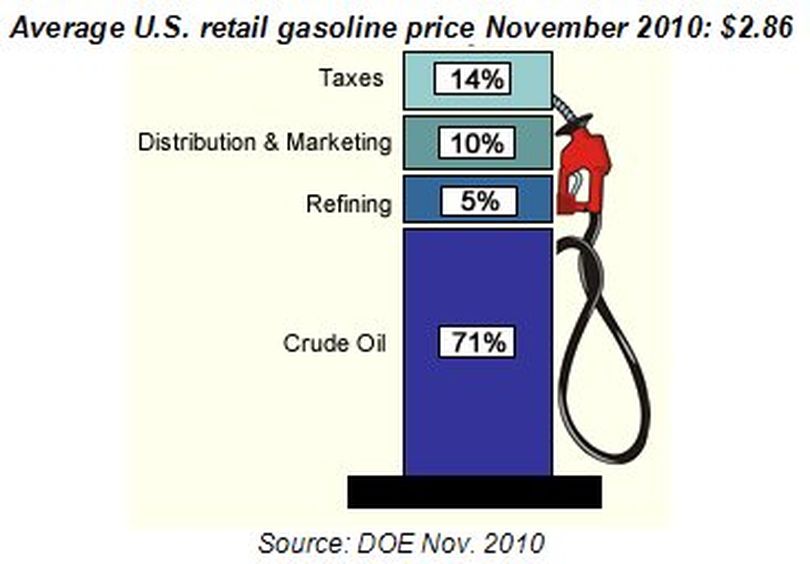
Where does the price of gas come from? An infographic from DOE

Today's interesting business-related chart or graphic comes by way of the feds, and from DOE in specific.
It's the typical breakdown, based on U.S. averages, for what goes into the cost of a gallon of gas.
This was created in winter of 2010 and the average price of gas has soared since then, but the general percentages seem not to have changed too much. Notably, only about 71 percent of the cost of gas at the pump is for the cost of crude oil.
The adjustment for Idaho and Washington's portion of taxes shows this.
This chart was created when the U.S. price for regular averaged about $2.86.
Today it's averaging $3.808, according to AAA. In Washington the regular price average on Wednesday is $3.89. In Idaho it's $3.64, also from AAA data.
State, federal and local taxes account for about 56 center per gallon of regular in Washington. In Idaho the number is 43 cents per gallon of regular.
